Netflix’s “Kaleidoscope”
Netflix’s Kaleidoscope: Showlabs Reveals Viewership & Episode Order Trends

A modern and unusual idea or an overcomplicated washout?
Since we've already seen everything, creators are racing to find new and better concepts to attract viewers. We got amazing stories, unadaptable adaptations, stunning special effects, interactive shows, and many more fireworks. But the more we watch, the more we expect. Is the latest Netflix title, "Kaleidoscope," the answer to the audiences' demands?
Released on January 1, 2023, "Kaleidoscope" was thought of as one giant gimmick. The story of master thief Leo and his cunning revenge is presented in a different order for every viewer. So although the series concludes the same for everyone, there are many paths to get there.
"Kaleidoscope" is made with rewatching it in mind. If the viewer misses threads between episodes, the best way to catch up is to rewatch everything chronologically. Starting with episode violet, followed by green, yellow, orange, blue, white, red, and ending with pink.
Although the concept of "Kaleidoscope" isn't new, and at some point has been used in literature ("Hopscotch" by Julio Cortázar), it still seems fresh as the basis of SVOD's content. But did the audience really like it? Rotten Tomatoes shows relatively average scores of 46% (Audience) and 48% (Tomatometer), but let's see what Showlabs data shows.
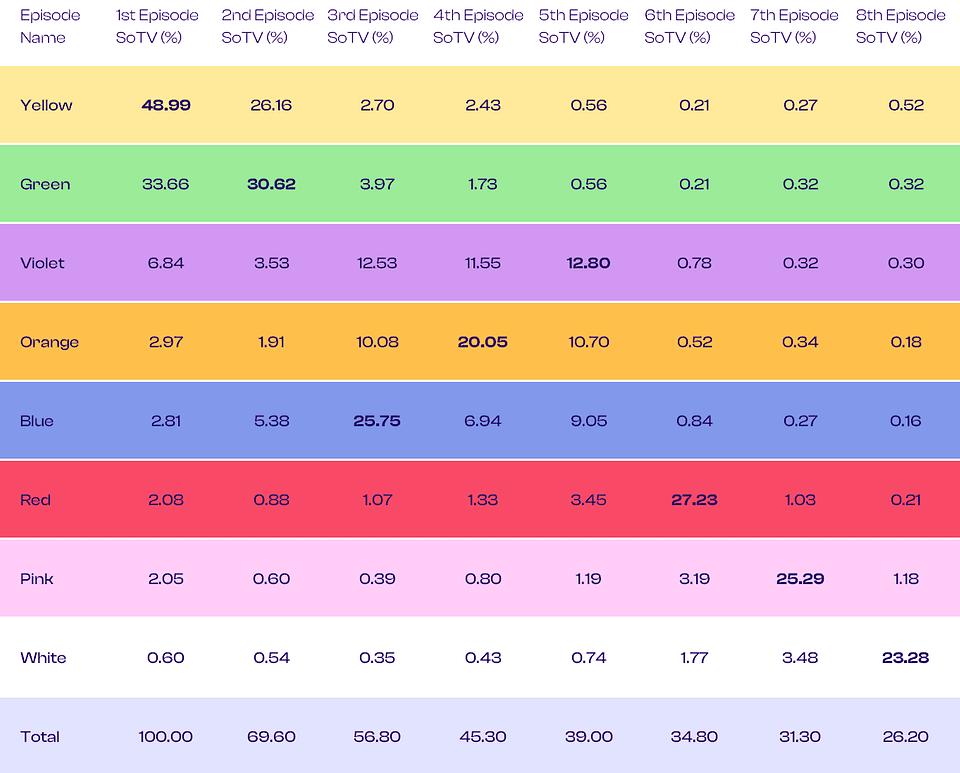
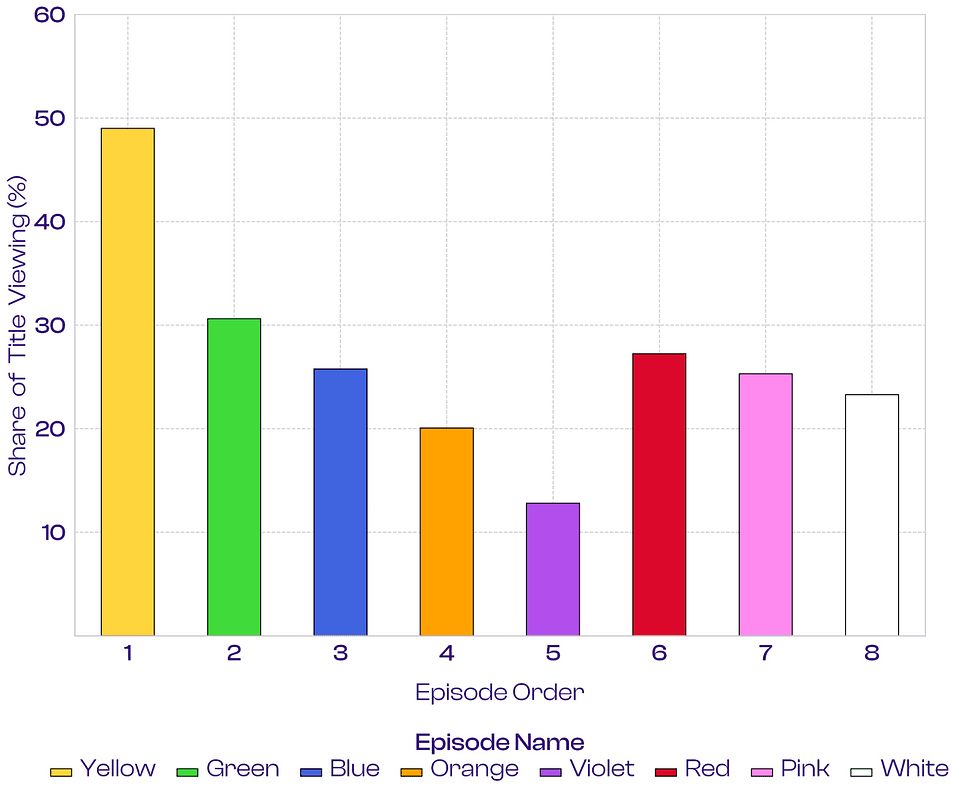
The first question we asked was if we could discover the most popular order to watch "Kaleidoscope." We focused on the first ten days after its release in the United States.
Looking at episodes' numbers, we can see that Yellow was watched as the first most often, engaging 49% of viewers (according to Share of Viewing (SoV) metrics). At the same time, chronologically, the first one — Violet, gathered only 6.8% of viewers.
It's also significant that, in total, we see a gradual but clean decline in the audience's interest in the story. In total, from the episode watched at first till the last one, SoV's decreased by more than 70%.
Kaleidoscope, Share of Title Viewers (SoTV) by Episode, 10 days after release, the United States
SoTV - % of Unique Viewers of the title that are watching the episode in n-th place
The data above shows that the most popular path to watch "Kaleidoscope" was: Yellow, Green, Blue, Orange, Violet, Red, Pink, and White. However, let's keep in mind that the White episode is always displayed as the last one for everyone who watches in unchronological order.
Kaleidoscope, Share of Title Viewers by Episode, 10 days after release, the United States
SoTV - % of Unique Viewers of the title that are watching the episode in n-th place
Now let's look at the other data describing "Kaleidoscope" to find out how popular the show had been for the first ten days after its premiere.
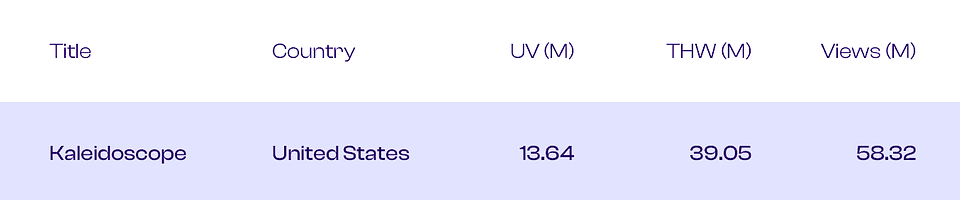
Kaleidoscope, Unique Viewers (UV), Total Hours Watched (THW), Views (V), 10 days after release, United States
Source: Showlabs by PlumResearch
After ten days after its release, "Kaleidoscope" gathered more than 13.5 M Unique Viewers (UV) with 39 M Total Hours Watched (THW). All viewers' activities on "Kaleidoscope" achieved above 59 M Views (V). But if the idea of rewatching it in chronological order will work, we'd see those numbers rising. We will keep our eyes on it and look forward to further formal experiments on streaming platforms!
PlumResearch specializes in precise and granular data measurement from streaming platforms. It has the world’s largest online audience panel and provides its clients with data from over 75 markets worldwide.
Through Showlabs - the proprietary platform created by PlumResearch - the company’s clients can find out how shows and movies are performing worldwide and track what exactly contributes to their success. Showlabs provides clients with accurate data, in-depth insights, and a reliable customer support team.